

Shapash 2.0 : Key features

Try out your own backend to connect any explainability method with Shapash’s nice visualizations !
The Shapash team believes in a world where data scientists can easily share insights to anyone about models they implemented. It has been conducting efforts recently into making the library modular and customizable. This way any team can take Shapash to their own needs and adapt only small parts if needed. Below we introduce the new features brought with the latest release but it is also a good occasion to review all the key features of Shapash.
Shapash’s latest release is the result of a great collaboration between MAIF and Quantmetry. Both companies are investing a lot of energy into tackling the problem of transparent and explainable AI. Shapash is one successful answer that is widely used internally but also by thousands of users worldwide.
Never heard of Shapash ?
Take a look at a demo here or visit the github page
Shapash key features
In this part we introduce the main outputs data scientists can produce with Shapash. If you already know Shapash you can skip to the second part where we discuss the new features of Shapash brought with the latest release.
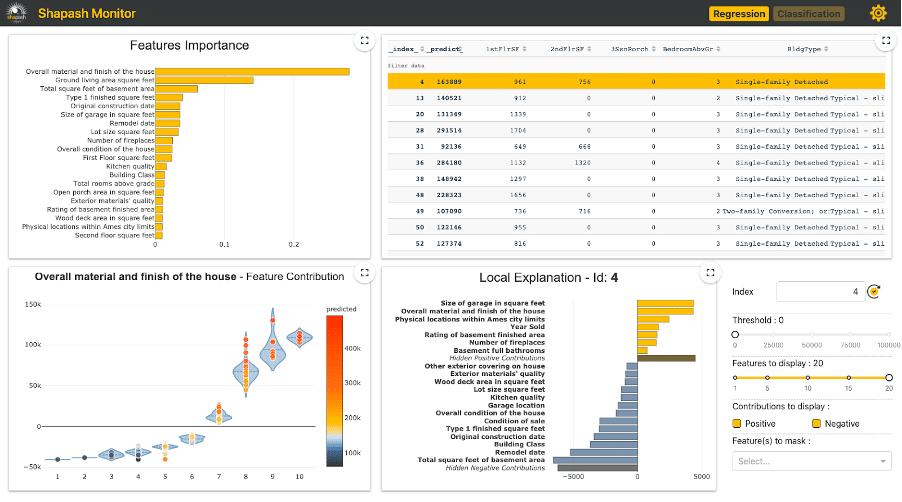
Shapash’s most used feature is its WebApp. It allows data scientists to easily explore and share information about a machine learning model.
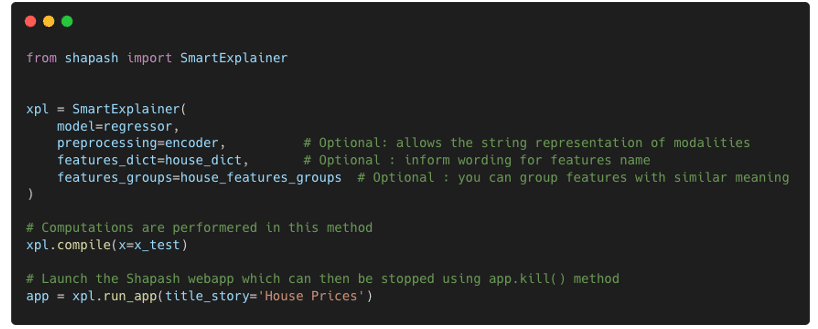
Launching the WebApp is straightforward. Using the simple lines above, Shapash will take care of computing the explainability and represent information about the model in the WebApp: global explainability on the left side and local explainability on the right side.
Some optional parameters can be very useful :
- Preprocessing allows passing the encoder used to encode categorical features into numbers. This way the numbers in the data (x_test) can be mapped to their original meaning (string representation) in the WebApp and other plots.
- Features_dict is the mapping between technical feature names and their domain names. This way the plots will not represent the column names of x_test but their corresponding mapping in
- Features_groups can be useful in case there are a lot of features. It allows to group features of the same meaning together and compute the explainability of each group. See the tutorial for more information
We only listed the most important parameters above. A complete list of parameters is available in the documentation.
Useful explainability plots
Many different graphs are available in Shapash and are very easy to produce. They can be displayed in a jupyter notebook or saved as images. Available graphs not only include the different plots in the WebApp but also others that can be useful to understand a machine learning model and interpret it.
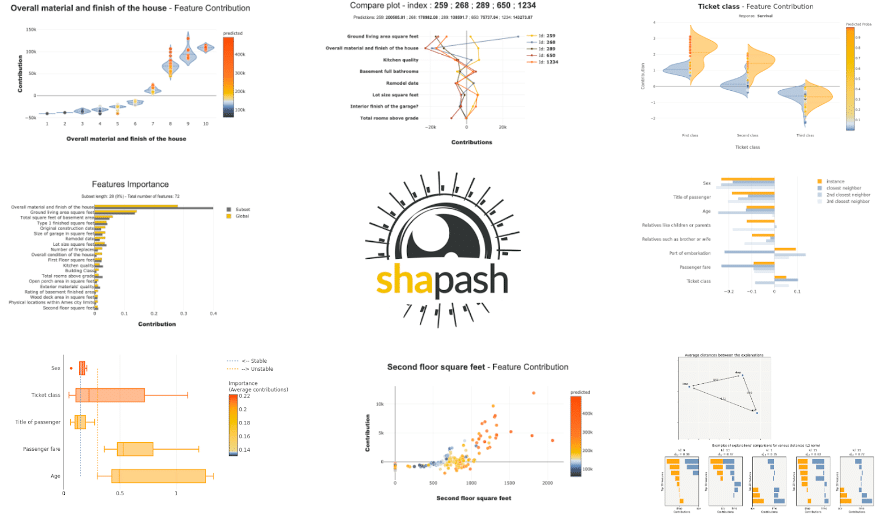
See the tutorial part to discover all available graphs
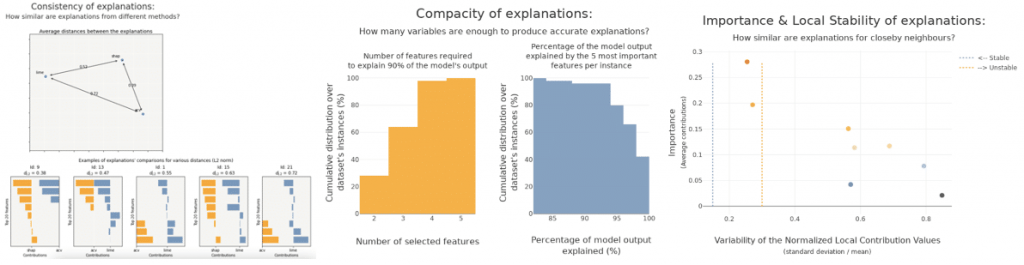
Explainability quality evaluation
Local explainability methods are recent, they keep being improved and research is very active in the field. Moreover, they often use approximations in order to speed up computations. Thus, one needs to be careful when interpreting those methods’ outputs.
Shapash recently added methods to evaluate and compare explainability methods computed on a given machine learning model. In particular, Shapash implemented graphs to answer the three following questions:
- Do different explainability methods give similar explanations on average ? (Consistency)
- Is the explanation similar for similar instances ? (Local stability)
- Do a few features drive the model ? (Approximation)
Detailed tutorial explaining how to build confidence with an explainability method
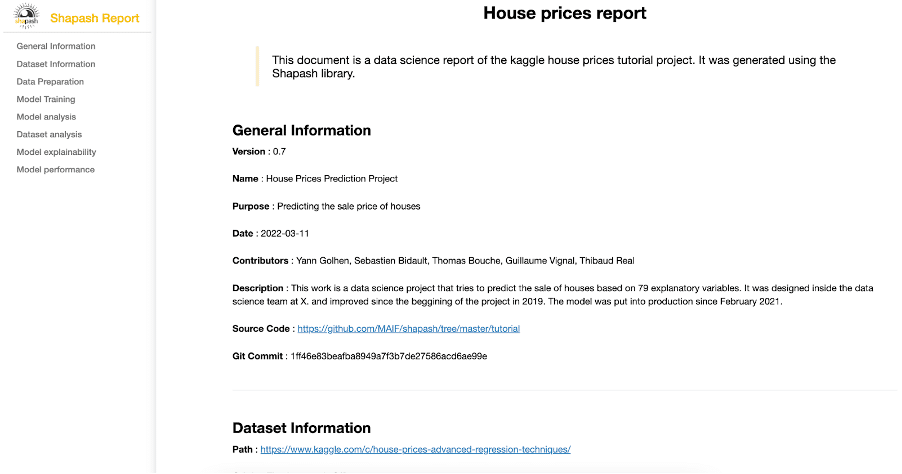
Project report
The Shapash Report allows data scientists to deliver a document that freezes different aspects of their work as a basis of an audit report. This document can be easily shared across teams ( email…) and does not require anything else than an internet connection. It is easy to adapt to any project needs through the use of the yaml project configuration file used to describe the project and then rendered in the report. It also constitutes an interesting support for data scientists who wonder what information should be included in a data science audit report.
An example of project report output is available here
To generate your own project report please refer to the tutorial.
New changes : Shapash 2.0 is out and it comes with some great new features !
Modular Backend
Shapash uses various backends to compute explainability metrics. Backends define specific ways to compute explainability data about a machine learning model which are then aggregated and rendered in Shapash’s graphs.
For example, Shap offers different approaches to compute local explainability (i.e. explainability for each prediction of a model). KernelShap is a model-agnostic method which allows the computation of local explainability on any given model. TreeShap offers a different and faster implementation for evaluating Shapley Values on tree-based models. More recently we added to Shapash the ACV approach to compute local and global explainability. ACV computations were quite different and did not rely on the same parameters of those used by Shap.
As more and more approaches are possible to explain a machine learning model, it seemed necessary for Shapash to accept any new backend easily.
To do so, we implemented an abstract class BaseBackend which defines a template that should be followed by each backend. This implementation not only allowed a clear and flexible internal behavior of the backends but also facilitated the custom use of any kind of explainability method by the users of Shapash.
The different backends could then be declared internally or outside of Shapash, inheriting the BaseBackend class.
Below we show an example of a simple new backend that anyone could implement using Shap’s KernelExplainer.
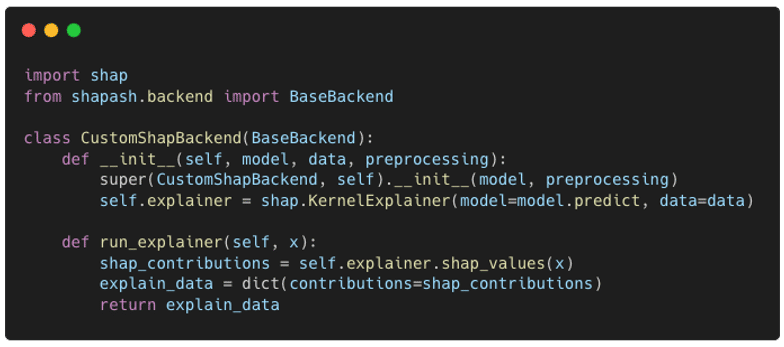
The implemented backend inherits from the BaseBackend class. The only method that is always required is the run_explainer method which returns a dictionary containing contributions (and other keys if necessary but usually this is not needed). Shapash will take care of the rest of the computations and aggregations to display the graphs. If one wants to customize the way to compute global explainability, it is also possible to surcharge the other methods of the BaseBackend class.
For more information about this feature, take a look at our new tutorial explaining how to use different backends.
Customizable colors
Shapash’s users may want to customize the colours of the plots to fit their organization’s or project’s theme. In order to facilitate the changes, we added the option to pass a dictionary of colours to easily change any colour of the graphs used in Shapash using the colors_dict parameter. More information about how to use this option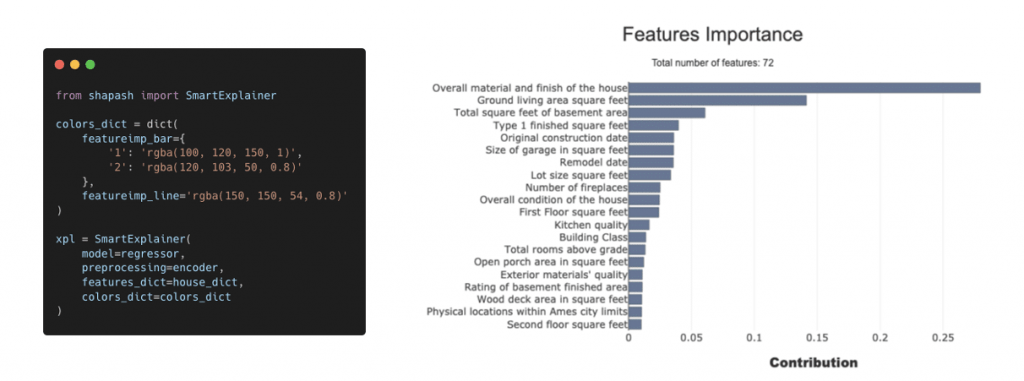
Using the colors_dict parameter, you can change the colour of any Shapash graph.
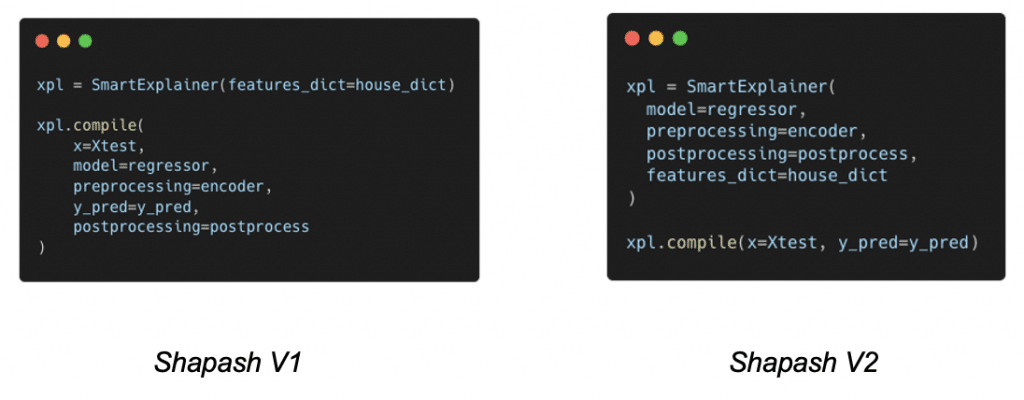
API changes
We had to introduce some breaking changes with the latest release. These changes mostly transfer parameters from the compile method of the SmartExplainer Shapash object to the initialisation of the class.
What’s next ?
Shapash already implements some great features but there will be a lot more to come! In particular, significant work is being carried out on the following topics:
- Explainable AI for NLP models : with recent technological breakthroughs in Natural Language Processing with BERT and other transformers models, it seems more and more interesting to explain these black box models.
- Data Drift : a subject that isn’t widely covered but not any less important concerning how your data might evolve over time. How to detect a drift? How to respond to it? These are two questions that we might try to answer.
Stay tuned !