

Load Testing Your Web Application with Locust

Load testing is a critical step in the development and deployment of web applications. It helps you understand how your application performs under heavy traffic, identify potential bottlenecks, and ensure that your users have a smooth experience. In this guide, we’ll explore how to perform load testing using Locust, a Python-based open-source tool that simplifies the process.
Before we delve into the specifics of Locust, let’s first understand the concept of load testing. Load testing is a type of performance testing that involves subjecting your web application to a high volume of concurrent users, simulating real-world usage. The goal is to assess your application’s performance, stability, and scalability under various loads. By doing so, you can identify and address performance issues before they impact your users.
What’s Locust
Locust is a popular open-source load testing tool written in Python. It’s designed to be developer-friendly and highly scalable, making it an excellent choice for load testing web applications. Key features of Locust include:
- Python-based: It leverages Python, a widely used and accessible programming language.
- Distributed testing: Locust can be easily distributed across multiple machines to simulate a high number of concurrent users.
- Real-time reporting: Locust provides real-time insights into test performance, allowing you to monitor results as your tests run.
- User behavior modeling: You can easily simulate complex user behaviors and scenarios in your tests.
Several performance metrics can be measured during the test. These performance indicators will help identify bottlenecks or validate thresholds defined in the specification. Here are some interesting performance indicators to measure during a performance test:
- Throughput: the amount of data transmitted.
- Memory: the amount of data stored.
- Response time: the time elapsed between sending a request and receiving a response.
- CPU: CPU usage.
Now, let’s see how we will leverage the Locust framework to conduct our performance tests!
Locust primarily allows measuring response times for different functionalities, considering the number of users and the number of requests on the application.
Play with Locust:
To get started with Locust, you should create a Python virtual environment and install any necessary dependencies for your project. This helps maintain a clean and isolated environment for your testing. you’ll need to install it.
virtualenv -p python3 locust-env

. locust-env /bin/activate

pip install locust
Creating a basic Locust test is straightforward. Tests in Locust are written in Python and follow a specific structure. Let’s create a simple example that simulates users visiting a websitehttps://my.website.comwith 2 endpoints:
- ‘/version’: that returns the version of the web application.
- ‘/core’: to receive information or request from the user.
In a new file locust_file.py, add the following import statement:
from locust import HttpUser, task


class ProjectTest(HttpUser):

   host = "https://my.website.com"

    @task

    def version(self):

        response = self.client.get("/version")


    @task(3)

    def core(self):

       self.token = “entre your token”

       headers = {'Authorization': 'Bearer ' +self.token}

        response = self.client.post("/core", headers = headers, data = '''{"question":"whats your name?"}''')
The HttpUser class is an instance of HttpSession that provides a testing client. In other words, when a test starts, Locust will create an instance of this class for each user it simulates, and each of these users will run in their own thread.
You can now implement your scenario in a method preceded by the @task decorator. In Locust, each method containing the @task decorator is considered a task to be executed.
You can control the workload of your different tasks based on a reference task, and thus increase the number of executions of one or more tasks. For the subsequent tasks, you can add an integer ’n’ as an argument to the @task decorator to increase the number of times this task is launched. In fact, if you specify this integer ‘n’, this task will be executed ‘n’ times more than the first task.
In this example, the core() task will be executed 3 times more often than the version() task. If we add a new task with the @task(6) decorator, this task will be executed 6 times more than the reference task, which in our case is the version() task.
Focusing on the post request, headers can contain authorization parameters, which could be found in the browser by inspecting the of your web application. Data contains the information that could be send to your backend as a body.
When it comes to a hosted application on a server, headers that include authorization parameters, like in POST request in our example. It can be located in the browser by inspecting the header of your web application. Data contains the information that can be sent to your backend as a body.
To run your load test, use the following command:
locust -f locust_file.py
Once the Locust web interface is running, you can access it in your web browser at http://localhost:8089. Here, you can start and manage your load tests, specifying the number of users and the hatch rate.
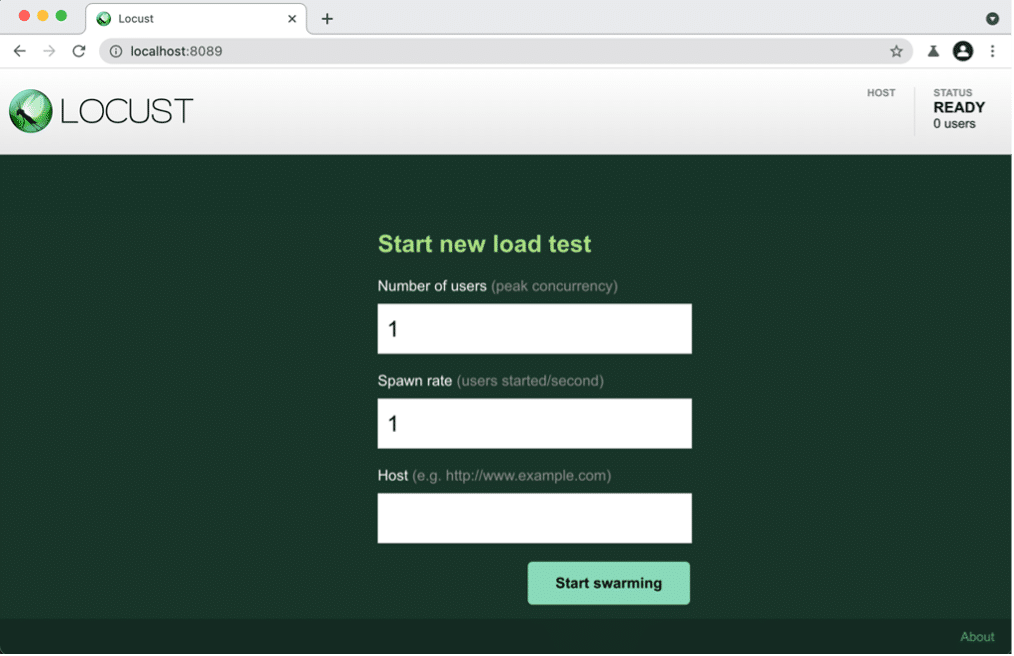
Figure 1: Locust Standard Homepage
On this page, you need to specify:
- Number of users: the total number of users to simulate.
- Spawn rate: the rate at which users are created, it corresponds to the number of users created per second until the total number of users is reached.
- Host: the address of your application, in our case, the application is running on localhost.
Now click the « Start swarming » button when you’re ready. The framework will execute the tasks indefinitely until you manually stop the test by pressing the « Stop » button in the top right corner of the page.
Analysing Results:
Locust provides real-time monitoring and reporting. You can view important metrics like the number of requests per second, response times, and the number of failures. Analysing these metrics will help you identify performance bottlenecks and potential issues with your application.
You can then analyze the results using the summary table or through the Charts tab, which provides graphical representations of the test results.
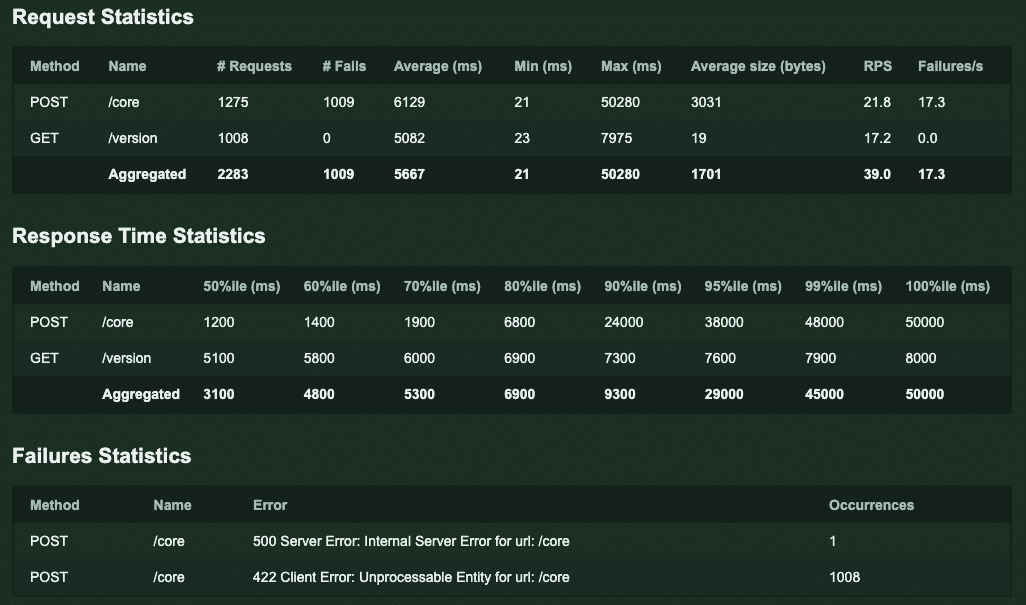
Figure 2: Results from load testing
The statistics provided by the table allow for analyzing the performance of our application. Here are the different parameters :
- Requests: Total number of requests made so far.
- Fails: Number of requests that have failed.
- Median: Response speed for the 50th percentile in milliseconds.
- 90%ile: Response speed for the 90th percentile in milliseconds.
- Average: Average response speed in milliseconds.
- Min: Minimum response speed in milliseconds.
- Max: Maximum response speed in milliseconds.
- Average size: Average response size in bytes.
- Current RPS: Current requests per second.
- Current Failure/s: Total number of failures per second.
What to keep in mind about Locust:
Load testing is an essential part of ensuring your web application can handle real-world traffic. Locust, with its Python-based simplicity and scalability, is a valuable tool for this purpose. By mastering Locust, you can identify and address performance issues before they affect your users, delivering a more reliable and responsive web application.
Incorporate Locust into your development process today and put your web application’s performance to the test.
Les membres de l’expertise Data & Tech conçoivent et mettent en œuvre des plateformes data robustes et évolutives.
Les membres de l’expertise AI Product conçoivent, développent et industrialisent des produits IA de plus en plus complexes (Web et mobile apps, API, etc.) en s’appuyant sur une approche « ROIste ».

Data Engineer at Quantmetry
Passionate about the field of data, its scientific, technical and business challenges. My current position at QM allows me to continue to explore data engineer tools and data science approaches, push my limits and improve my knowledge.

Software Engineer at Quantmetry
As a full-stack developer at Quantmetry, I thrive on exploring AI and cutting-edge tech. Passionate about innovation, I leverage my role to craft robust solutions, constantly evolving in the dynamic AI landscape.